BNB Price Stalls: Struggles to Resume Gains While Altcoins Rally
NewsBTC
2025-07-16 13:48:26


BNB price is correcting gains from the $708 zone. The price is now facing hurdles near $692 and might dip again toward the $675 support.
- BNB price is attempting to recover from the $675 support zone.
- The price is now trading below $690 and the 100-hourly simple moving average.
- There is a key bearish trend line forming with resistance at $692 on the hourly chart of the BNB/USD pair (data source from Binance).
- The pair must stay above the $680 level to start another increase in the near term.
BNB Price Faces Hurdles
After a steady increase, BNB price failed to clear the $710 zone. There was a downside correction below the $690 and $680 levels, unlike Ethereum and Bitcoin.
The price even dipped below $678 and tested $675. A low was formed at $674 and the price is now attempting to recover. There was a move above $680. The price climbed above the 50% Fib retracement level of the downward move from the $707 swing high to the $674 low.
However, the bears are active near $692. There is also a key bearish trend line forming with resistance at $692 on the hourly chart of the BNB/USD pair. The price is now trading below $690 and the 100-hourly simple moving average.
On the upside, the price could face resistance near the $692 level. The next resistance sits near the $695 level or the 61.8% Fib retracement level of the downward move from the $707 swing high to the $674 low.
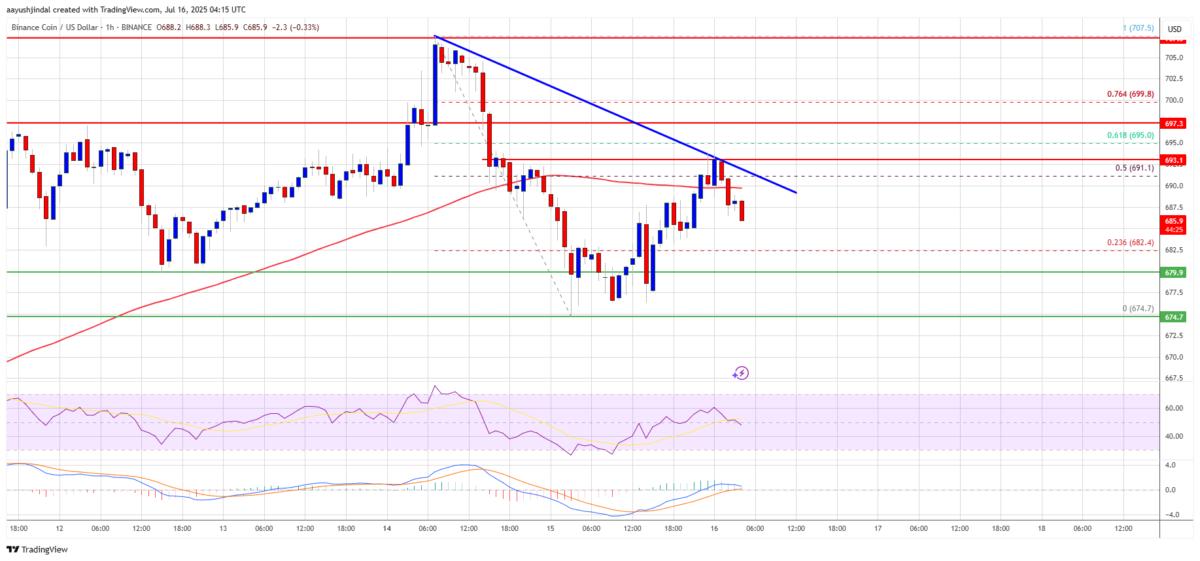
A clear move above the $695 zone could send the price higher. In the stated case, BNB price could test $708. A close above the $708 resistance might set the pace for a larger move toward the $720 resistance. Any more gains might call for a test of the $732 level in the near term.
Another Decline?
If BNB fails to clear the $692 resistance, it could start another decline. Initial support on the downside is near the $682 level. The next major support is near the $680 level.
The main support sits at $674. If there is a downside break below the $674 support, the price could drop toward the $665 support. Any more losses could initiate a larger decline toward the $650 level.
Technical Indicators
Hourly MACD – The MACD for BNB/USD is losing pace in the bullish zone.
Hourly RSI (Relative Strength Index) – The RSI for BNB/USD is currently below the 50 level.
Major Support Levels – $685 and $680.
Major Resistance Levels – $692 and $708.
最新快讯
ChainCatcher
2025-07-18 23:24:57
ChainCatcher
2025-07-18 23:11:55
ChainCatcher
2025-07-18 23:09:53
ChainCatcher
2025-07-18 23:06:34
ChainCatcher
2025-07-18 23:01:12